
With recent legal developments causing a temporary lull in active updates across the Bricks and Minifigs and Reckless Ben saga, I wanted to see if retail locations are experiencing a measurable impact from the surrounding controversy. I didn’t originally intend to cover this angle. However, a post on a satirical subreddit community caught my eye. A user shared an image of a real-time $5 off promotional coupon distributed by a local BAM store via text message.
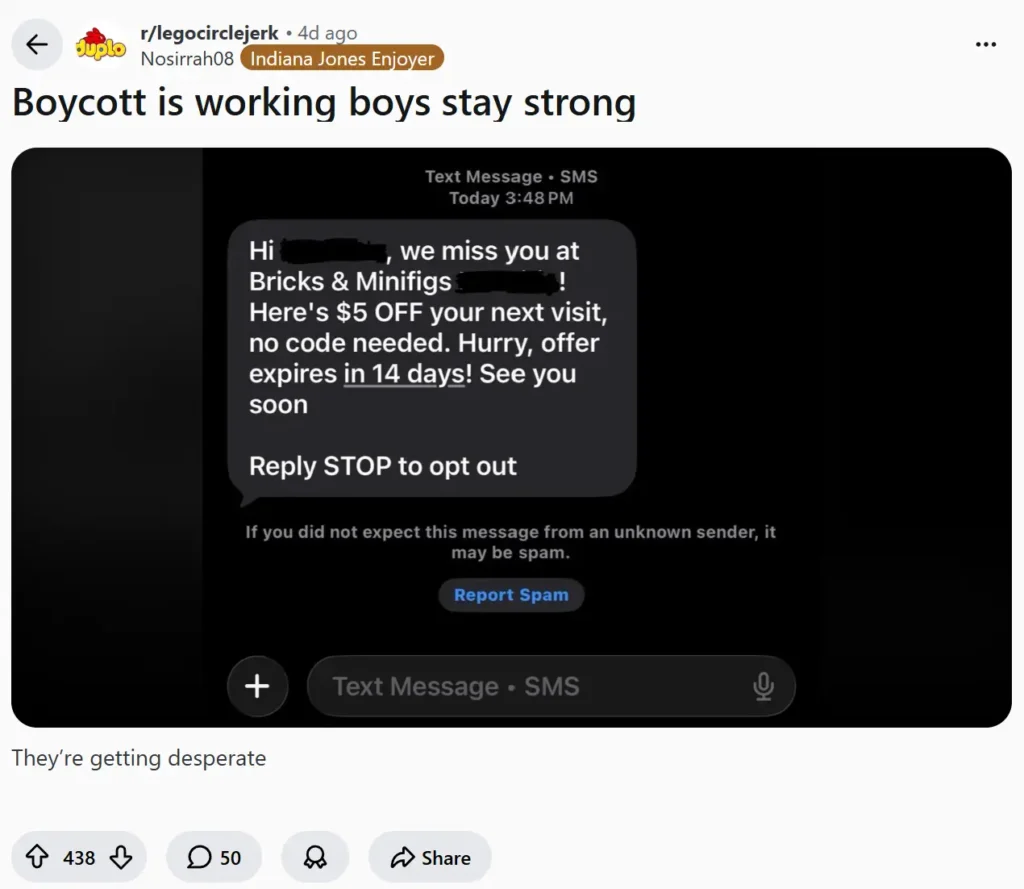
The comment section immediately filled with heated discussion about the brand, with some users arguing that the digital promotion pointed to a clear desperation to reclaim a wandering customer base, while others countered that BAM stores utilize these exact loyalty text blasts all the time, even well before the recent controversy erupted.
While I haven’t personally received one of these coupon codes, it is a textbook marketing play used by retailers to re-engage former buyers. It made me wonder, is the digital backlash actually translating to empty storefronts in the physical world?
Study Limitations and Scope
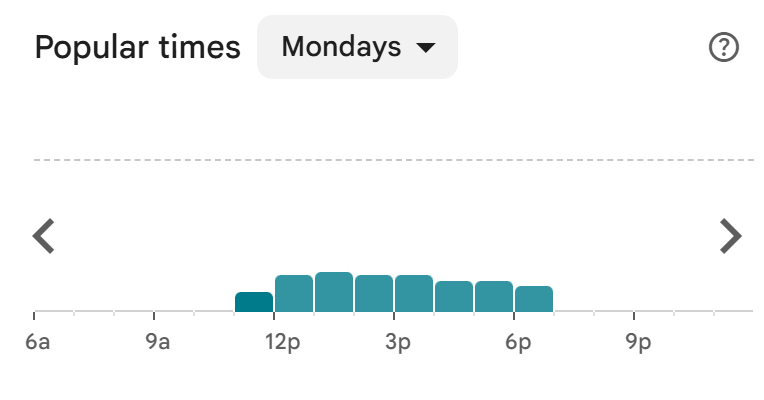
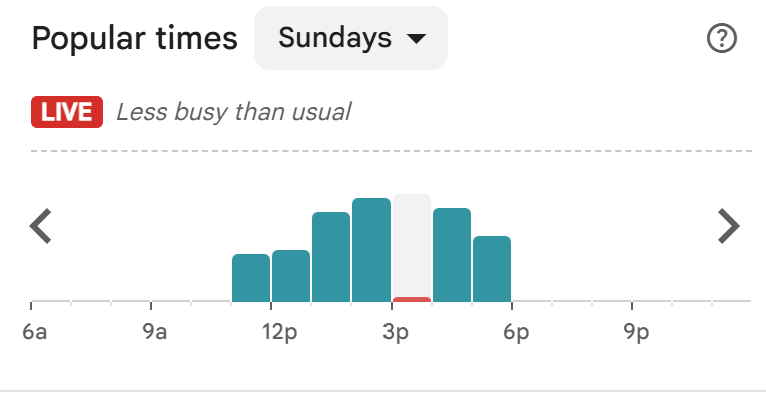
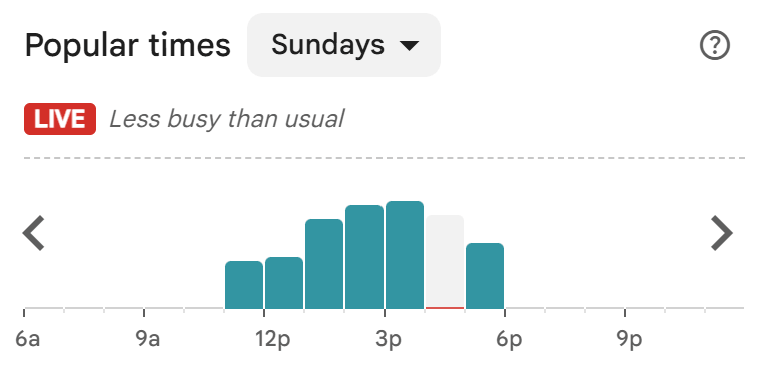
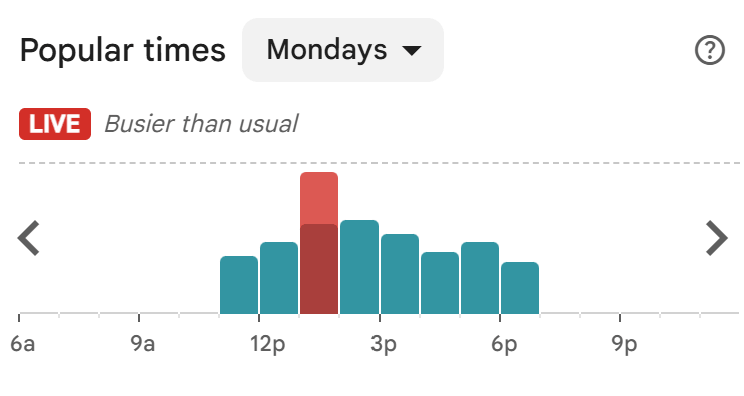
Before diving into the metrics, it is vital to establish complete transparency regarding the scope and boundaries of this data set. First is the limited sample size; this small study tracks a hyper-focused group of 5 unique store locations across distinct regions of the United States. Next is the restricted timeframe, as this study only covers observation windows on specific daytime intervals monitored across 3 consecutive days, specifically the past Sunday, Monday, and Tuesday.
The third and perhaps most vital limitation is the sheer data volume. With over 300 storefronts operating in the United States and many locations remaining open for 8 to 10 hours a day, a comprehensive national tracking initiative yields a baseline possibility of 2,400 to 3,000 data points a day, and scales past 7,200 to 9,000 across a standard 3-day span. Because we only tracked 55 distinct points of data, this sample is far too small to be considered statistically significant.
Finally, this tracking initiative exclusively covers foot traffic fluctuations. There is no available point-of-sale data to calculate exactly how much consumers were spending once inside the building. Our goal was simple: sample different geographic markets to get a clean cross-section of how regional audience sentiment is manifesting at the store level.
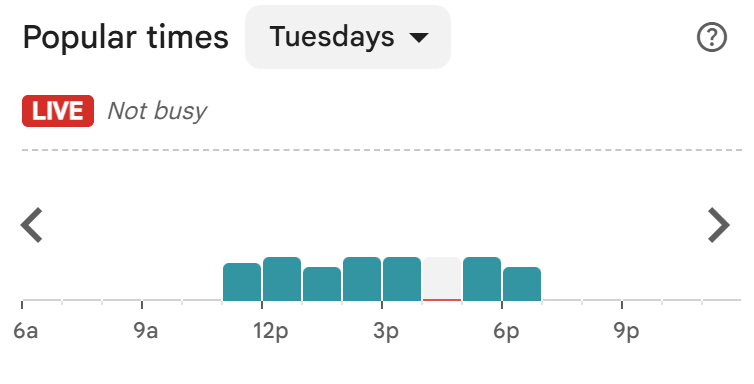
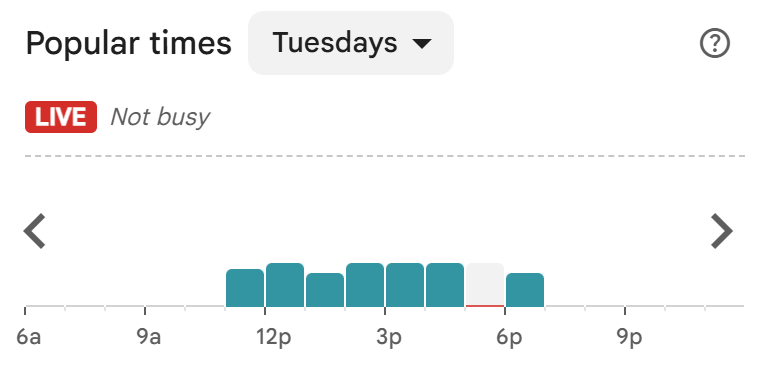
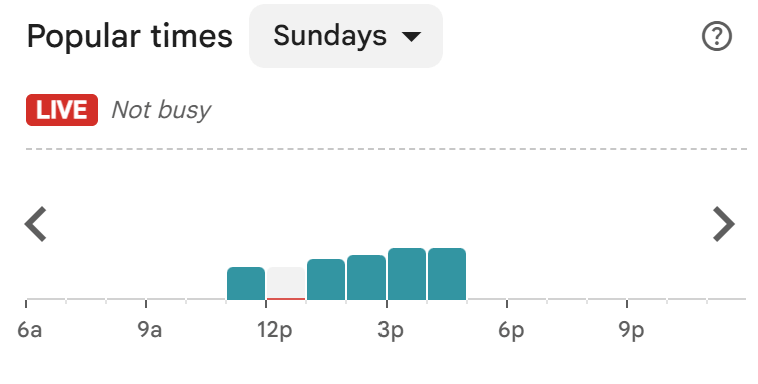
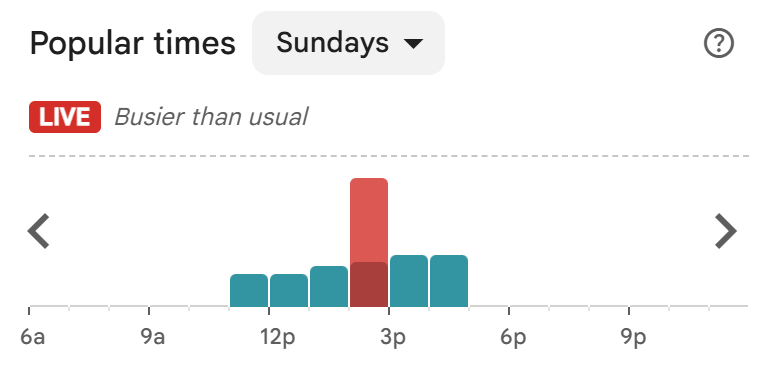
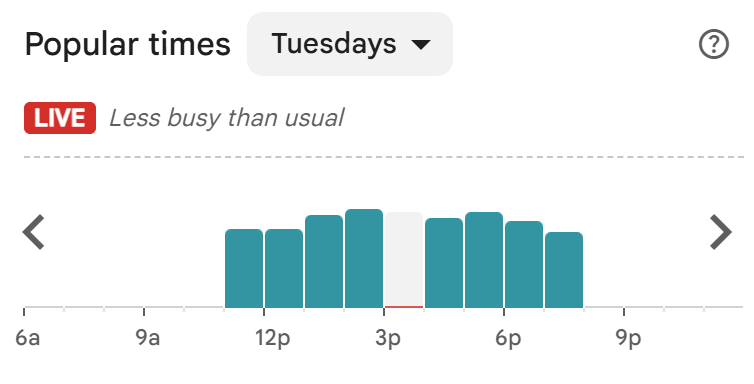
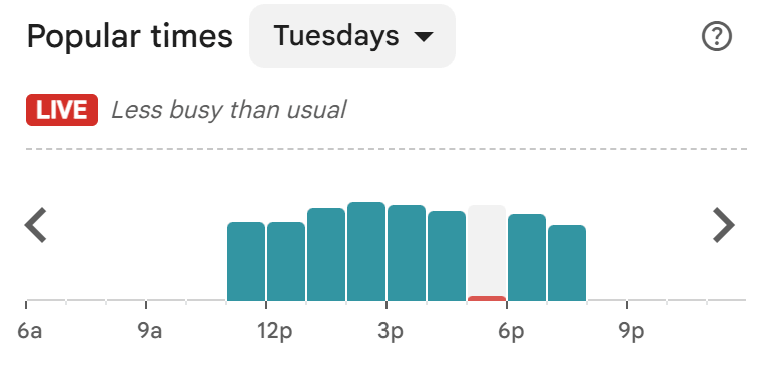
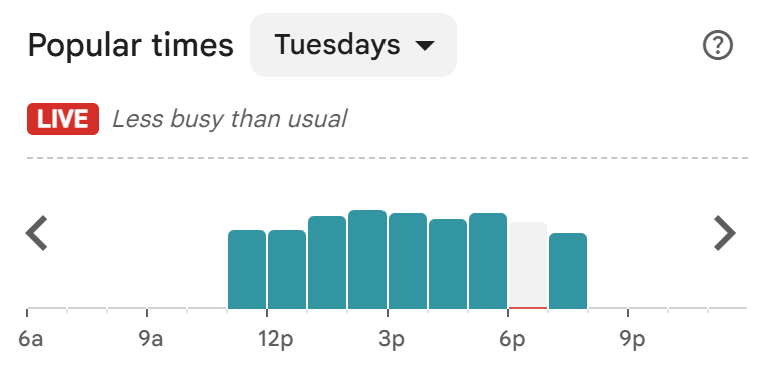
The Macro Metrics
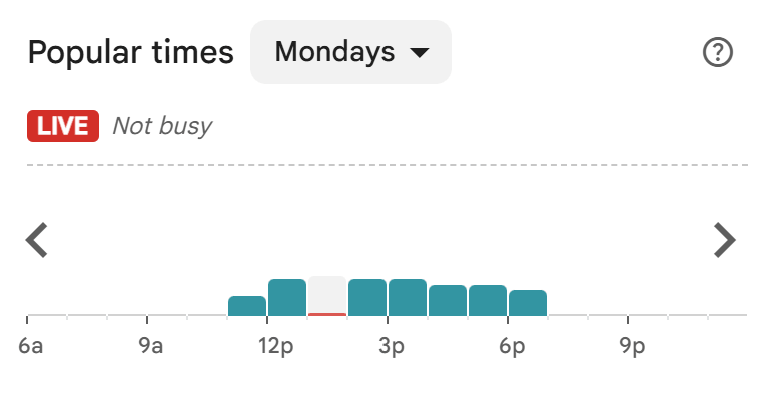
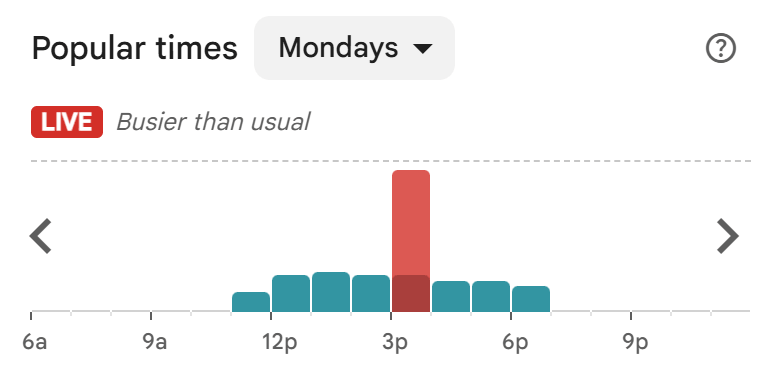
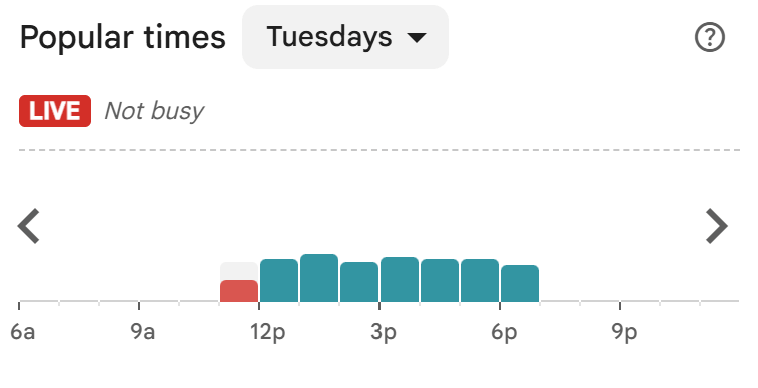
When we pool the real-time tracking points across all five locations, the aggregate numbers reveal a stark departure from ordinary retail trends. The most glaring number from the data is that 59.6% of all recorded hours showed a drop-off, flatlining well below the historical baseline traffic expected for those specific times. Conversely, 34.6% of the monitored timeframe featured sudden, vertical traffic spikes, meaning the physical spaces were tracking as significantly busier than usual. That leaves a mere 5.8% of the observed hours showing traffic staying completely level with normal, expected everyday baselines.
When you combine the severe customer drops and the sudden crowd surges, we are looking at a massive 94.2% total disruption rate from normal, passive foot traffic flows. The data strongly indicates that steady, predictable daily shopping patterns have essentially vanished for these specific locations.
Mapping Volatility Across Locations
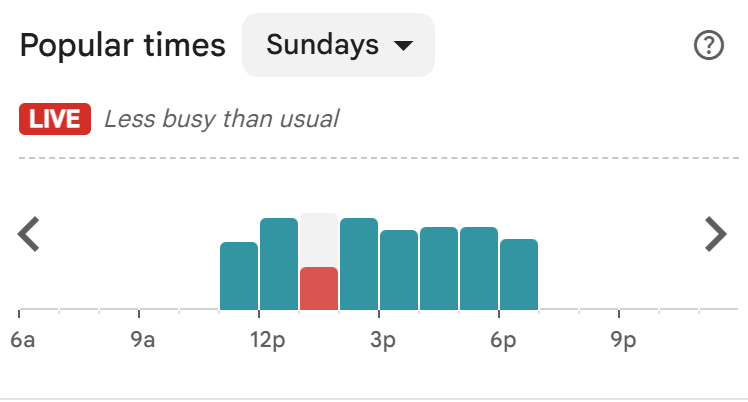
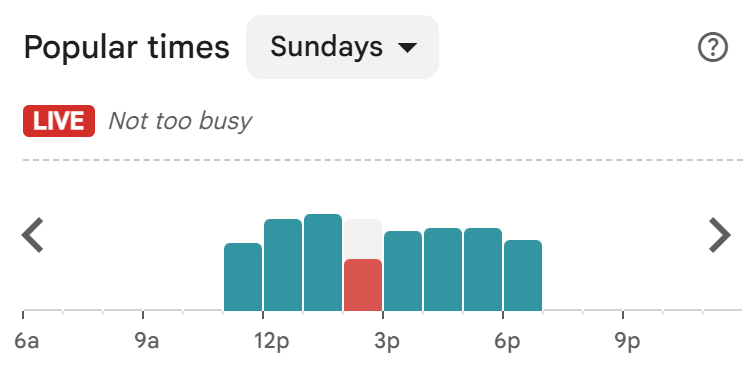
When tracking volatility across these different locations, the data proves that the real-world fallout does not look the same in every city. Instead, the footprints reveal entirely different community dynamics under pressure.
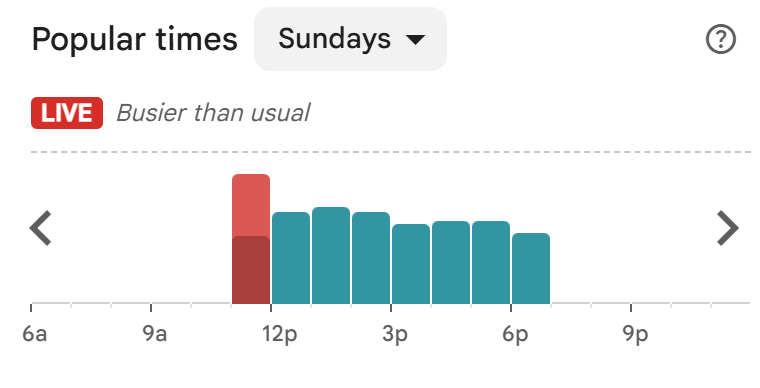
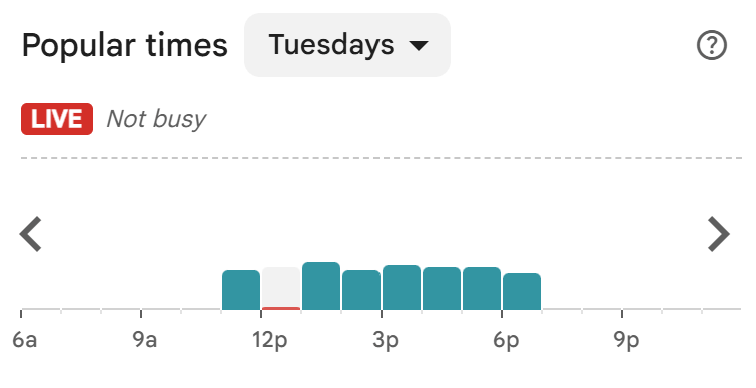
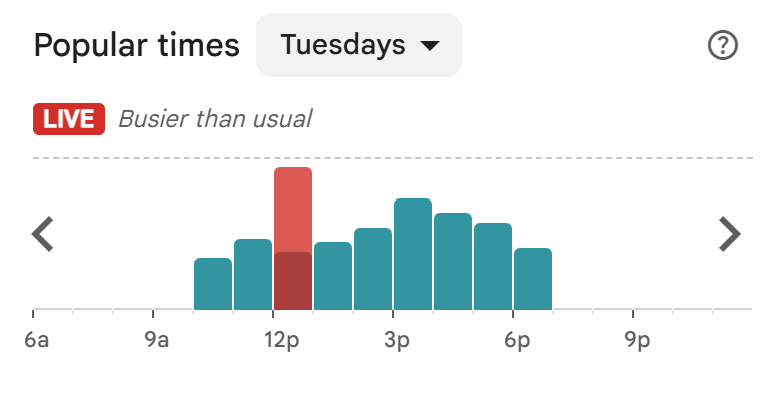
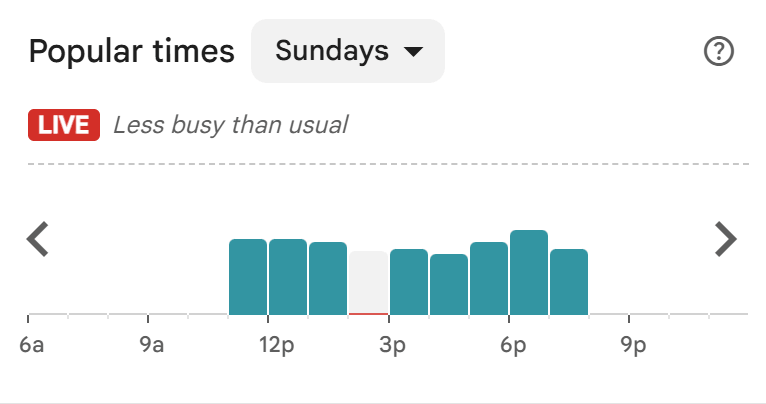
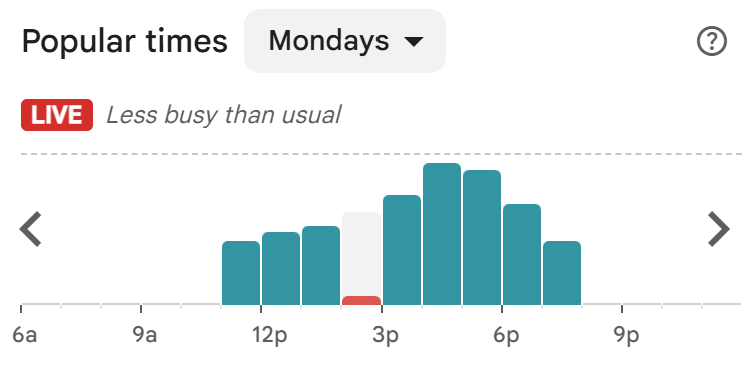
Store 1 showcased a volatile metropolitan profile, where standard weekday lunch hours completely cratered while prolonged curiosity waves lingered late into the afternoons.

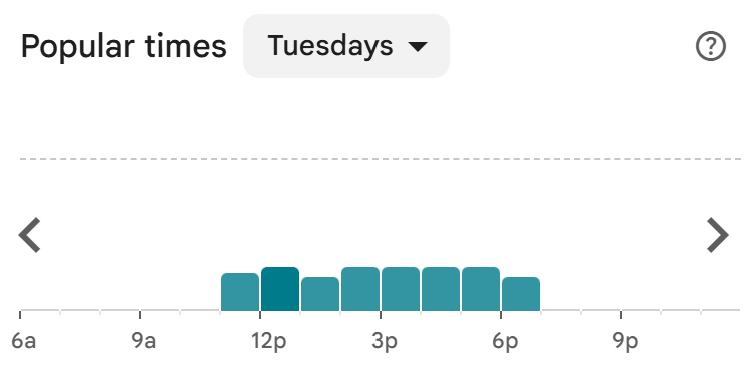
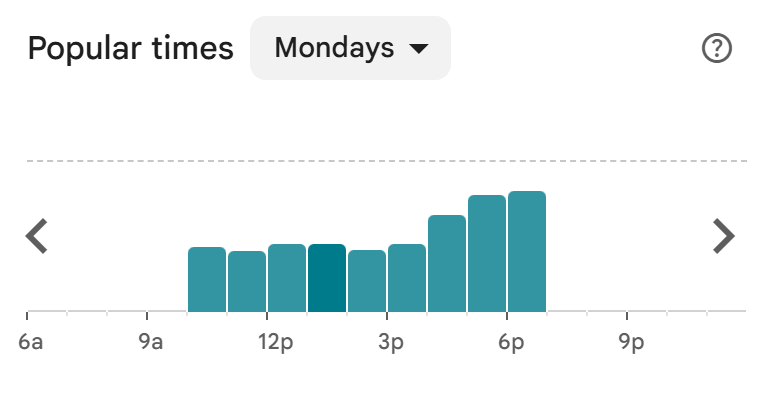
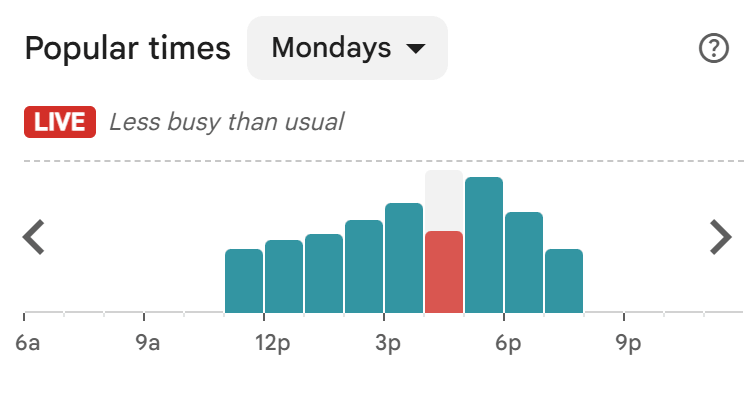
Store 2 experienced short-term bursts of structured, rigid midday crowd spikes over the weekend that completely burned out by Tuesday, leaving behind a permanently depressed baseline.
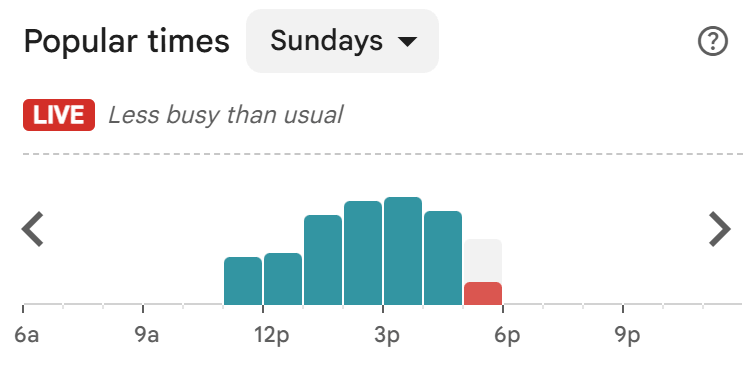
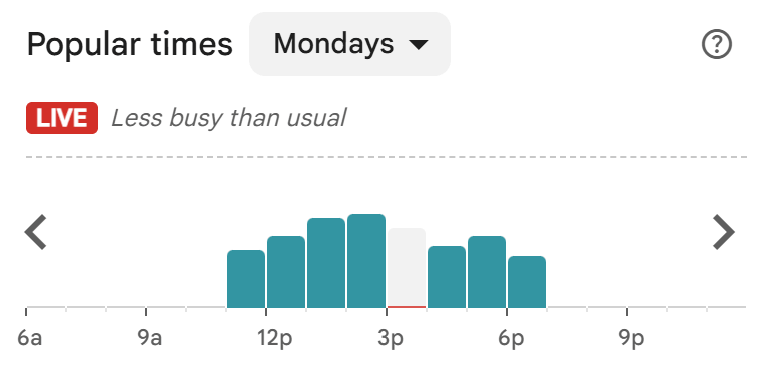
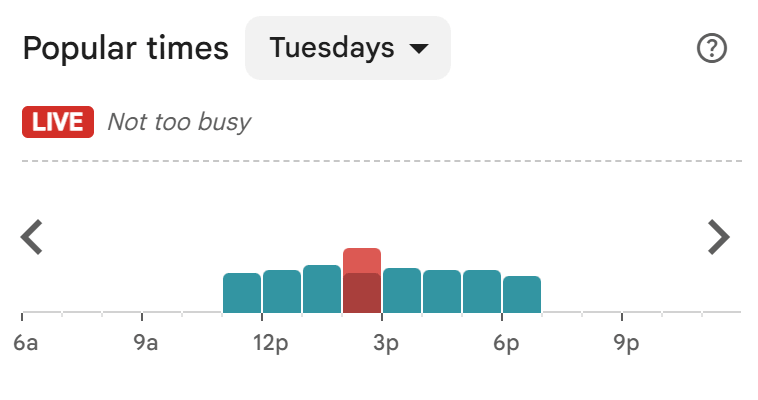
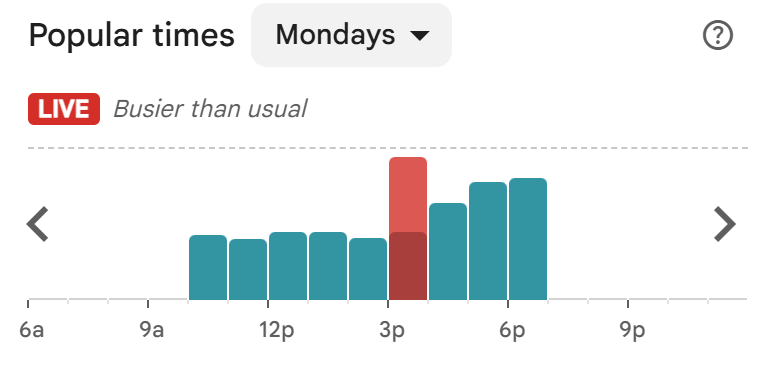
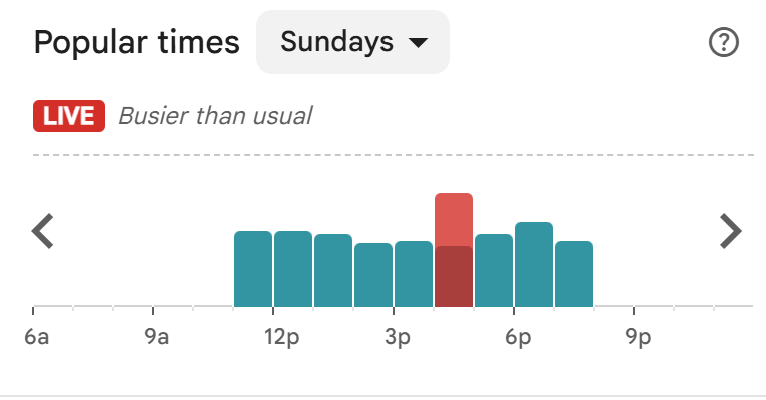
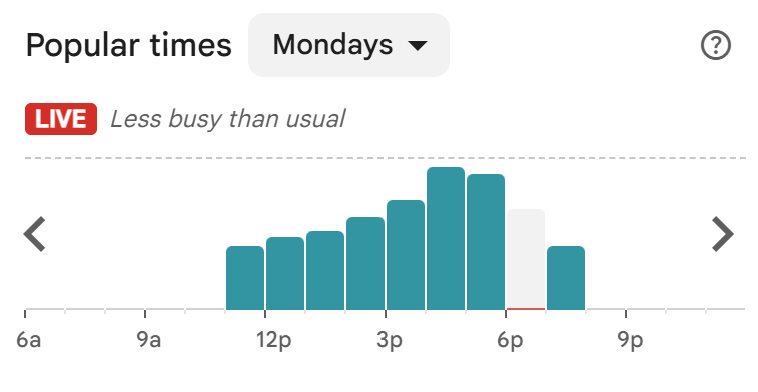
Store 3 served as our epicenter flashpoint profile. Located closest to corporate roots, it registered hyper-synchronized, clockwork afternoon vertical surges that actively shifted to match the working calendar.
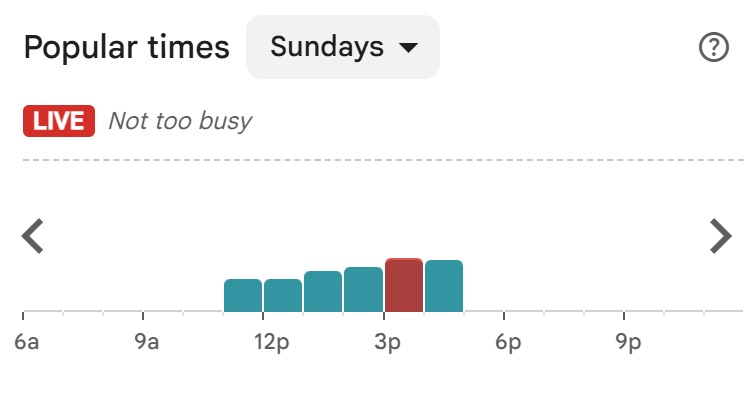
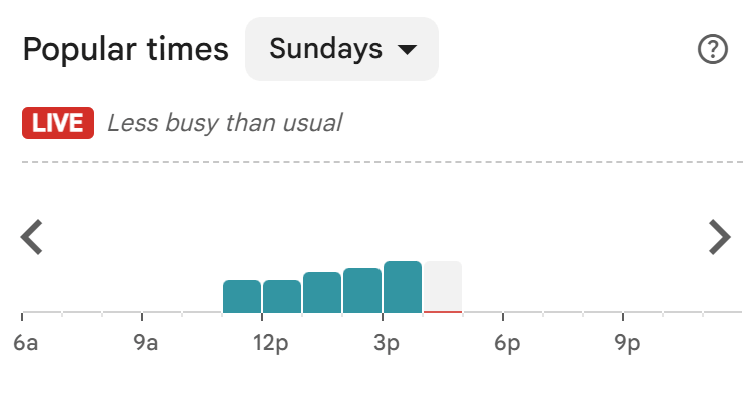
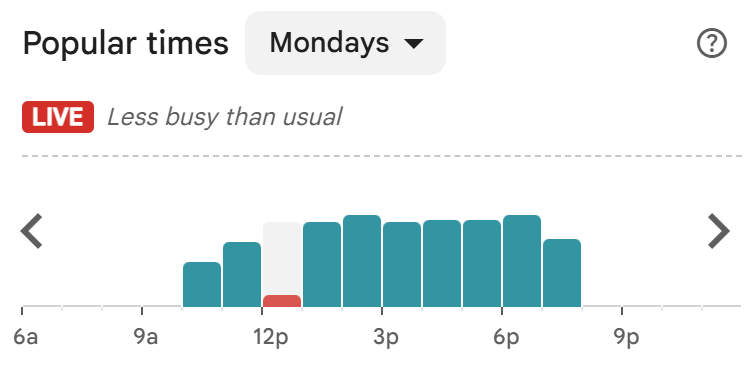
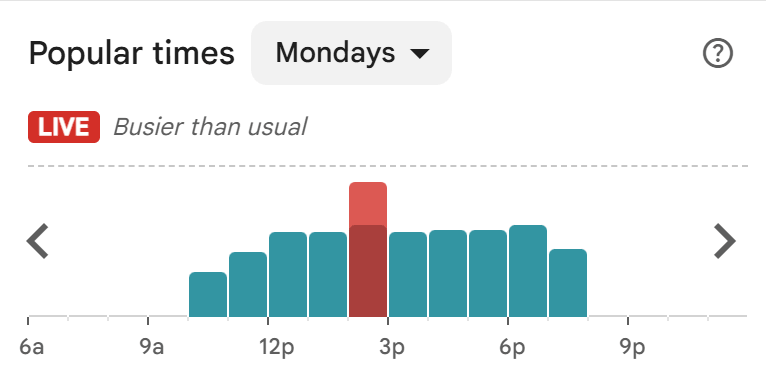
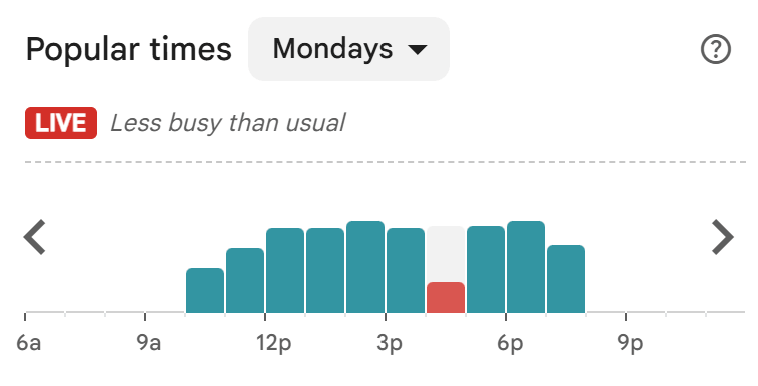
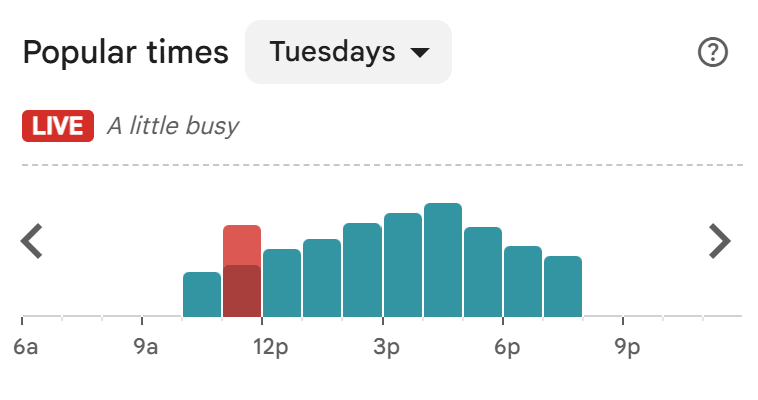
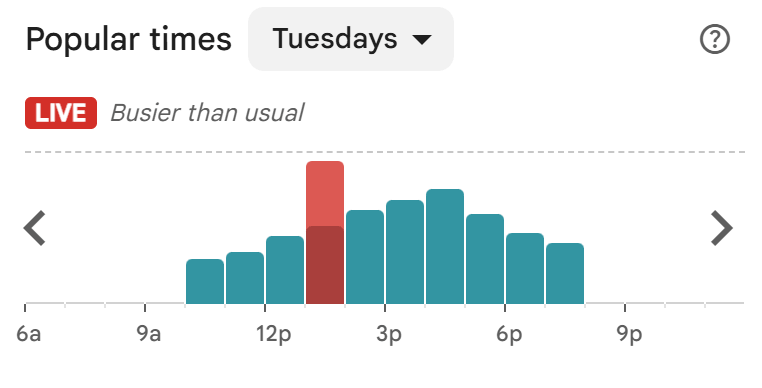
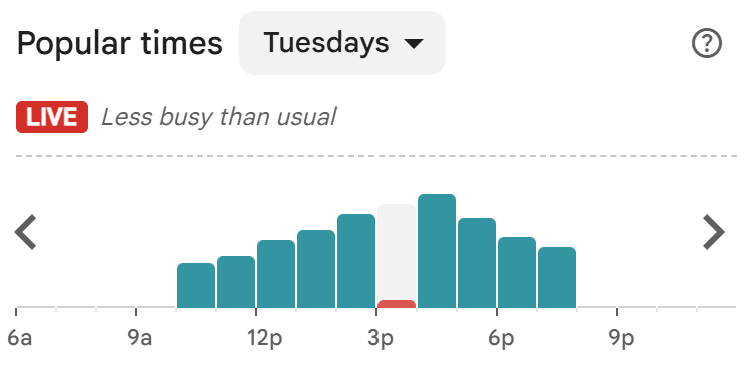
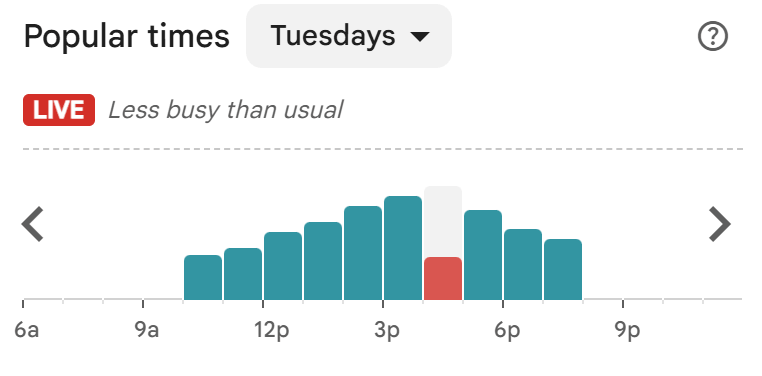
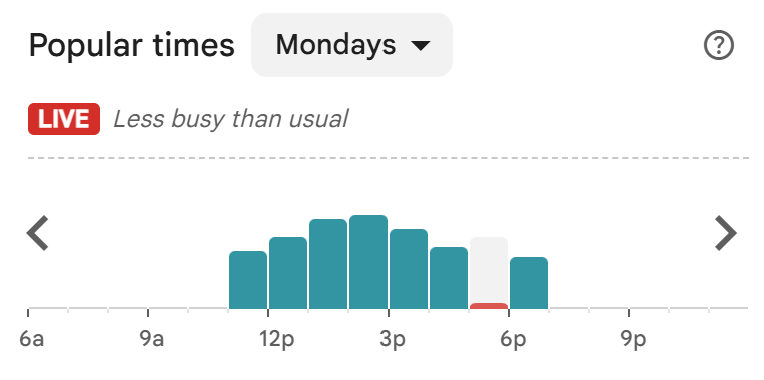
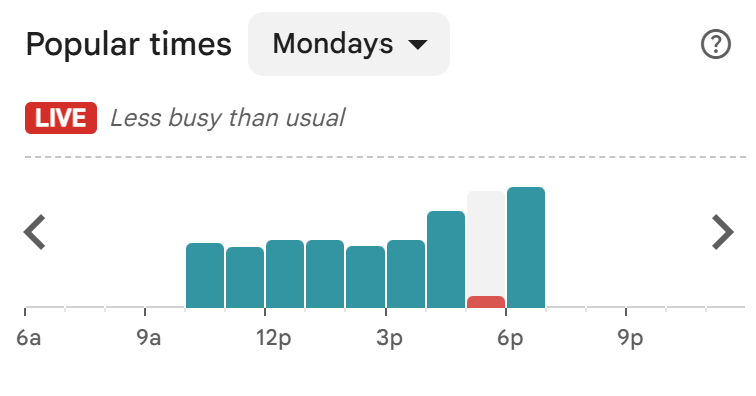
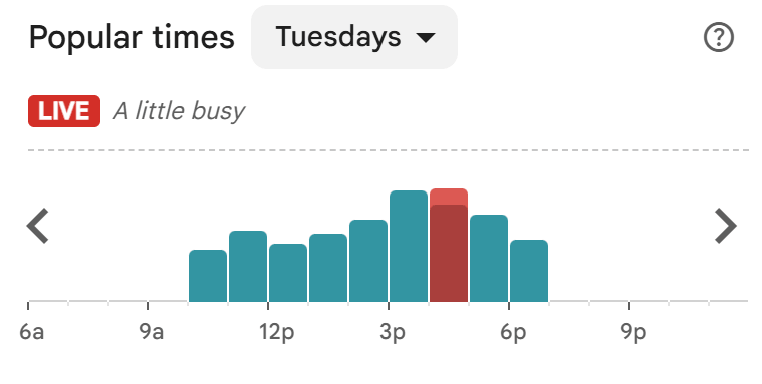
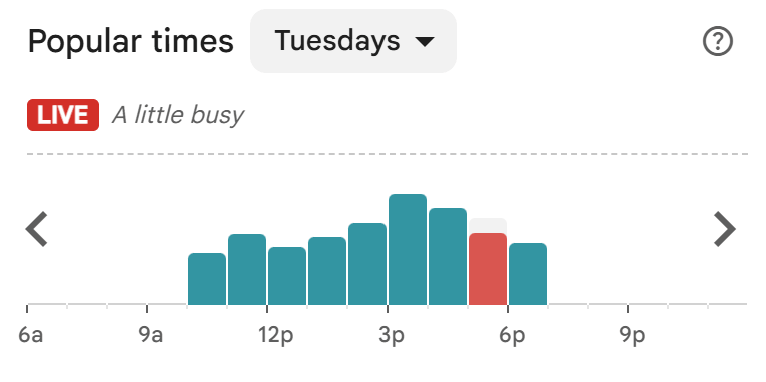
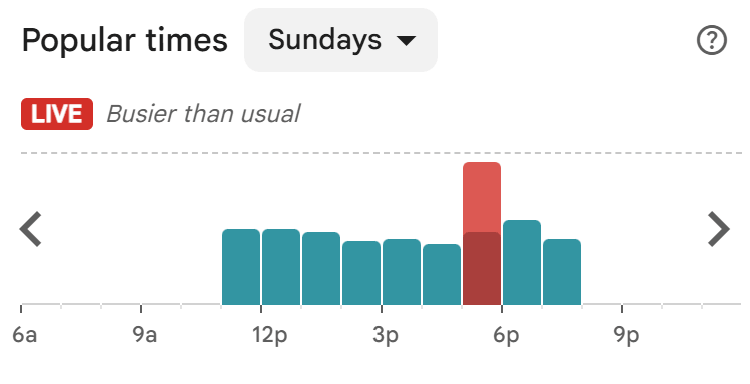
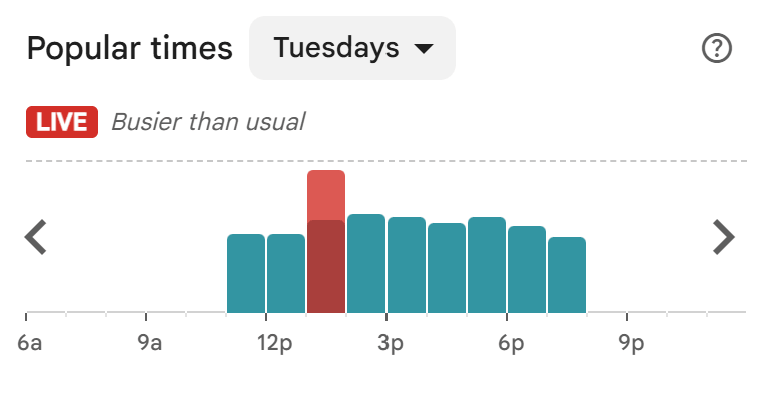
Store 4 felt the sharpest “whiplash effect,” posting the highest overall volatility score of 1.75 due to instantaneous, binary swings from maximum capacity warnings down to near-zero traffic within consecutive hours.
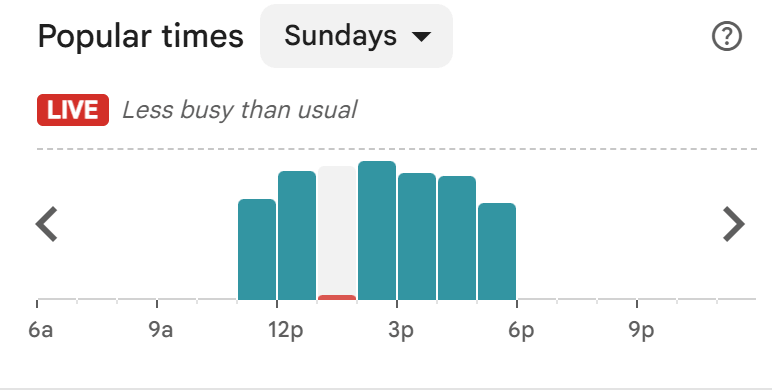
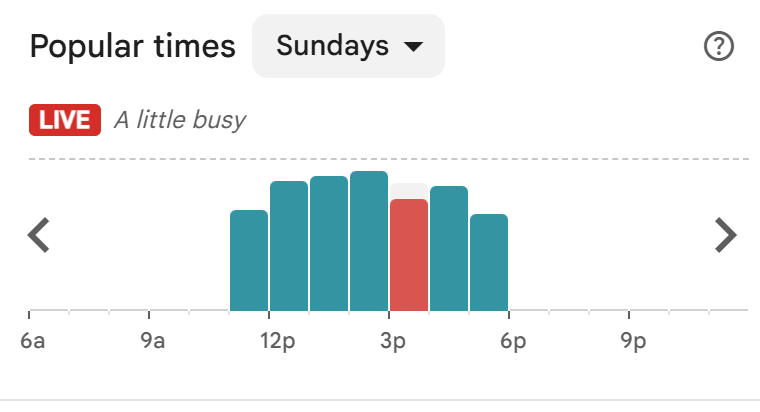
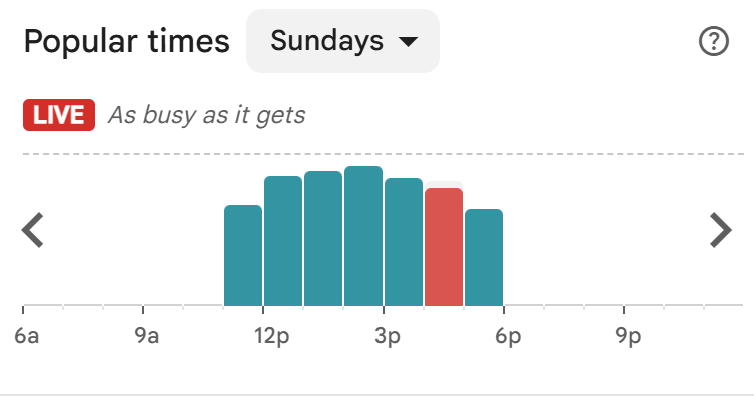
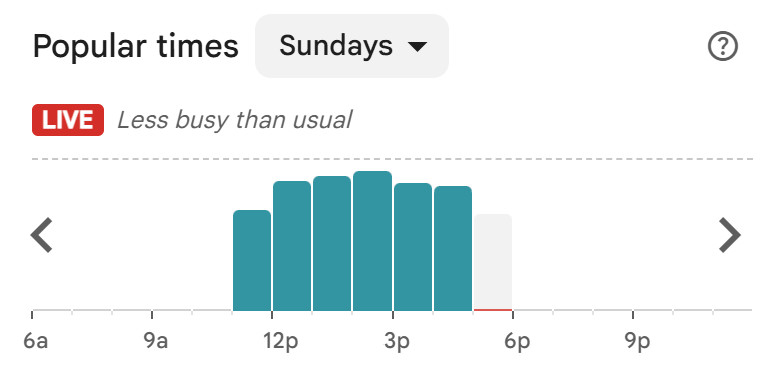
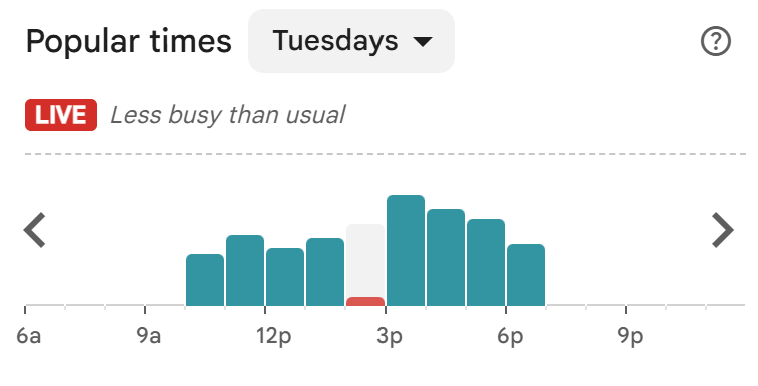
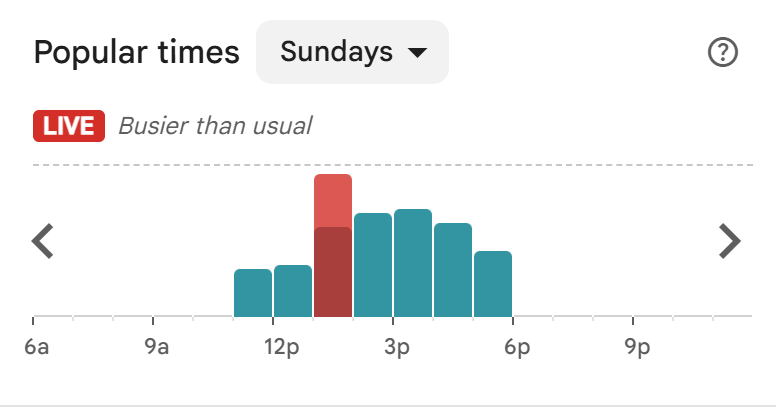
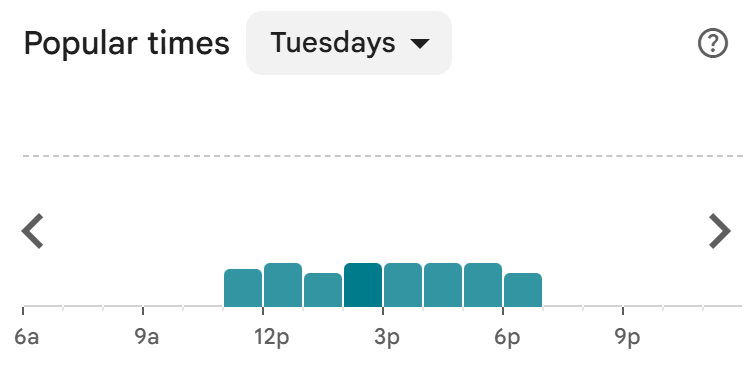
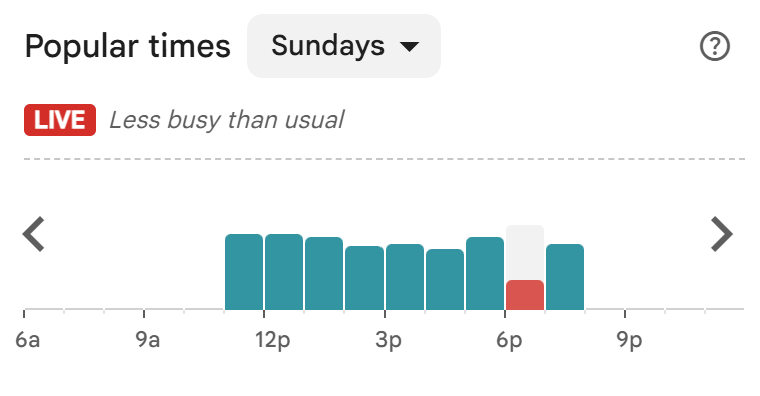
Store 5 offered the cleanest signature of a sustained consumer boycott, facing deep system-wide weekday flatlines where everyday organic foot traffic completely evaporated, broken up only by fleeting weekend interest waves.
What the Data Says
Ultimately, the data captured over these three days reveals a undeniable decline in foot traffic compared to the historical baselines these stores are accustomed to. However, because of our limited sample size and restricted timeframe, it is impossible to definitively conclude whether this depression is occurring across the hundreds of other franchise locations nationwide, or if these erratic patterns will persist into the future. Readers can draw their own conclusions from these metrics, but this three-day snapshot clearly indicates that these specific locations experienced a significant drop-off in regular customer volume. Suggesting that the real-world weight of the Bricks & Minifigs controversy has seeped into the retail floor over the past few days.
FinBriCo is an independent fan site and is not affiliated with, authorized, or endorsed by The LEGO Group.